
Making sure your site is fast and responsive is important for your visitors — and because of this, Google also factors site speed into search rankings. Speed is not now and has never been a “major” ranking factor (and Google’s John Mueller called the addition of Core Web Vitals “quite a subtle update”), but it is nevertheless important if you want to stay competitive.
In June 2021, Google added Core Web Vitals to the Page Experience algorithm for mobile (and in February 2022 for desktop). These are three metrics (and will likely be more in the future) designed to give a sense of how fast your site is, how quickly it responds to user input, and how much items shift around on the page. Collectively, the idea is to ensure that you are providing a good and fast experience for your visitors.
Because speed is one of the few ranking factors that Google actually tells us about, people tend to overestimate how important it is for SEO. It’s really just part of hundreds of factors Google considers — and it’s definitely not as important as having great content that provides value for your readers. In other words, site speed and Core Web Vitals are not “make or break” for a site — as long as a site is not extremely slow.
The page experience update introduces a new signal that our search algorithms will use alongside hundreds of other signals to determine the best content to show in response to a query. Our systems will continue to prioritize pages with the best information overall, even if some aspects of page experience are subpar. A good page experience doesn’t override having great, relevant content.
Google’s FAQ on Core Web VItals
Core Web Vitals also were rolled out for mobile in mid-June 2021. This was sandwiched between two big “core” updates in early June and early July 2021. The core updates caused a lot of volatility, but since it was less “hyped” than the Core Web Vitals rollout, many people attributed ranking changes to Core Web Vitals and site speed, when it really was the core updates instead.
Table of Contents
The three Core Web Vitals metrics are:
- Largest Contentful Paint (LCP) is the largest element on the page in the viewport when the page is first loaded, before scrolling (this is usually the top of the page, “above the fold”). The idea is that the largest thing visible is important, so this is a stand-in metric for how quickly the page loads for the visitor. It’s often the first image in a post, or your header image, a blog post title, or maybe the first paragraph of text — and that can vary from page to page.
- Interaction to Next Paint (INP) is how quickly the browser responds to the user input (clicks, taps, and keyboard interactions, typically).
- Cumulative Layout Shift (CLS) is a measurement of how much things move around on the page, both during the initial page load and afterward while the visitor is using the site. The idea is to avoid annoying visitors by having things move around on the page after they’re visible. It looks at how big each item is and how far it moves to calculate the score. It’s “cumulative” since things can continue moving around as the visitor is on the page.
On March 12, 2024, Interaction to Next Paint (INP) replaced First Input Delay (FID), and it is typically more difficult to optimize for than the old metric. You can read all about this change and how you can optimize INP in our article about the latest addition to Core Web Vitals.
How are they measured?
Google collects real-world timing data (“field data”) for the Core Web Vitals as people use the Chrome web browser. This is turned into the the Chrome User Experience Report (CRuX), and this database is what Google uses for its ranking algorithm.
It takes up to 28 days to collect this data, so if you make changes, these numbers will update slowly during the following weeks. You can see the data by running a test in Google’s PageSpeed Insights testing tool or by viewing the Page Experience report in Google Search Console for your site.
Google collects data on individual URLs. You can also see an “Origin Summary” which shows a summary of the results for all URLs on your domain. A PageSpeed Insights report will look something like this:
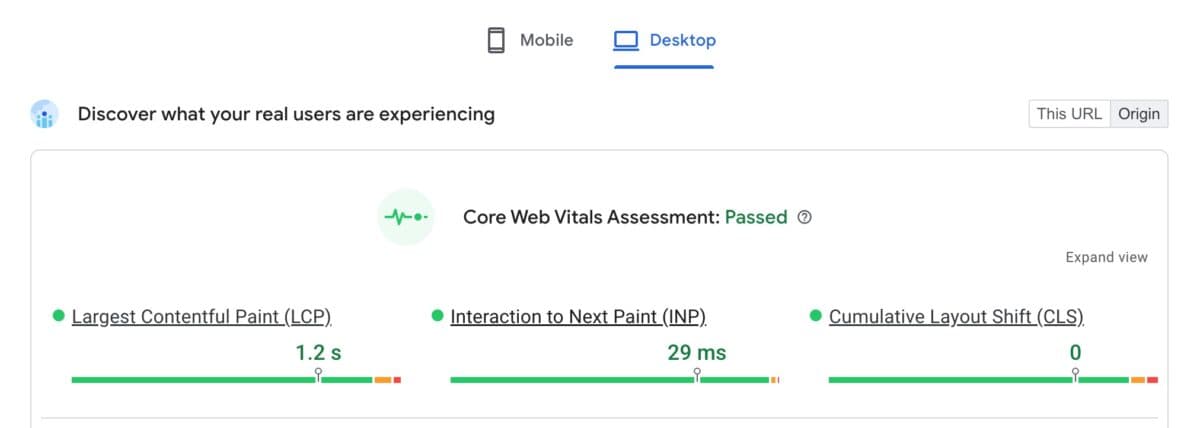
How good does a site need to be?
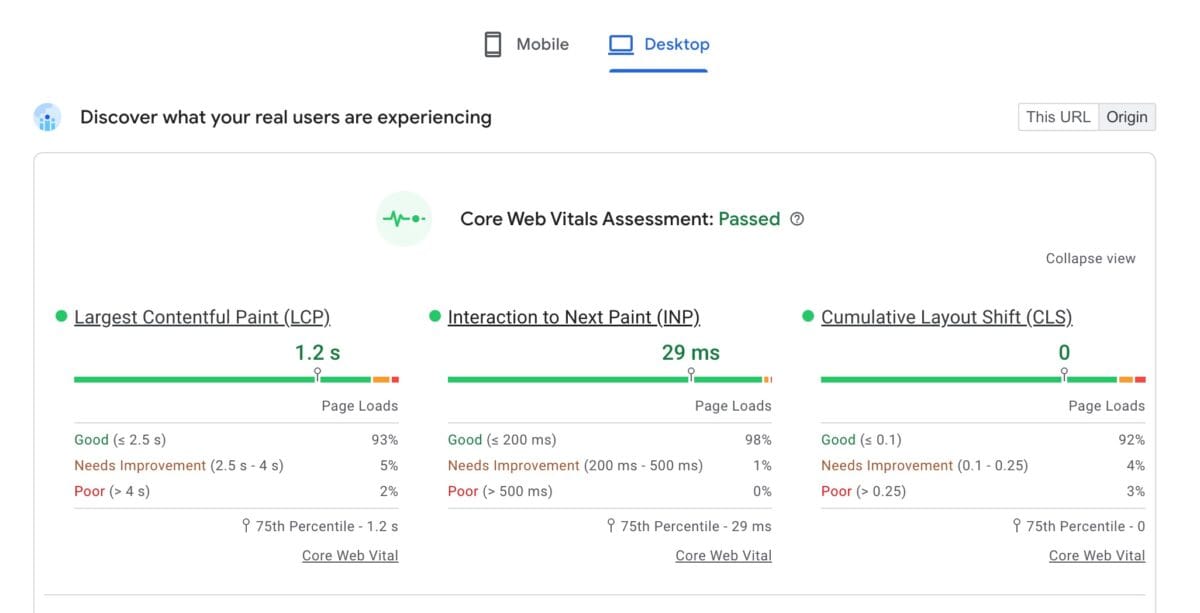
Google gives a goal for each metric separately and breaks each up into “Good,” “Needs Improvement,” or “Poor.”
Since the times will be a little different every time someone loads a page on your site, they look at the 75th percentile of page loads and use that as the score. So if 75% of pageviews have an LCP time of 2 seconds, that’s your overall score. This allows for pages to sometimes load a little bit slower, and that’s okay.
For Largest Contentful Paint, 2.5 seconds or lower is considered “good.” (2.5 to 4 seconds is “needs improvement,” and 4 seconds or slower is “poor.”)
For Interaction to Next Paint, 200ms or lower is “good.” (201ms to 500ms is “needs improvement, and 501ms or slower is “poor.”)
For Cumulative Layout Shift, a score of 0.10 or lower is “good.” (0.10 to 0.25 is “needs improvement,” and 0.25 or higher is “poor.” )
When Core Web Vitals were initially announced, they were “all or nothing,” meaning you’d need to “pass” (or be in the “good” range) for all three scores. However, in May of 2021, Google relented on this position, and now it is not all-or-nothing. The closer you are to the “good” range for each metric, the better for SEO. And then, once you’re in the “good” range, there’s no additional SEO benefit for further improvement — Google considers the “good” threshold to be a “very high bar.” Note, though, that further improvements may still be better for your readers.
Frustratingly, Google continues to use “Pass/Fail” language in the PageSpeed Insights testing tool and in Google Search Console. However, Core Web Vitals is definitely not pass/fail.
Realistically, this means that if your LCP is, for example, 2.6 seconds and is therefore flagged as “needs improvement” the actual real-world benefit of getting to 2.5 seconds (“good”) is going to be negligible.
Where to Test Your Site
Want to check your site’s Core Web Vitals? We recommend Google’s PageSpeed Insights tool or Web Page Test’s Core Web Vitals Test.
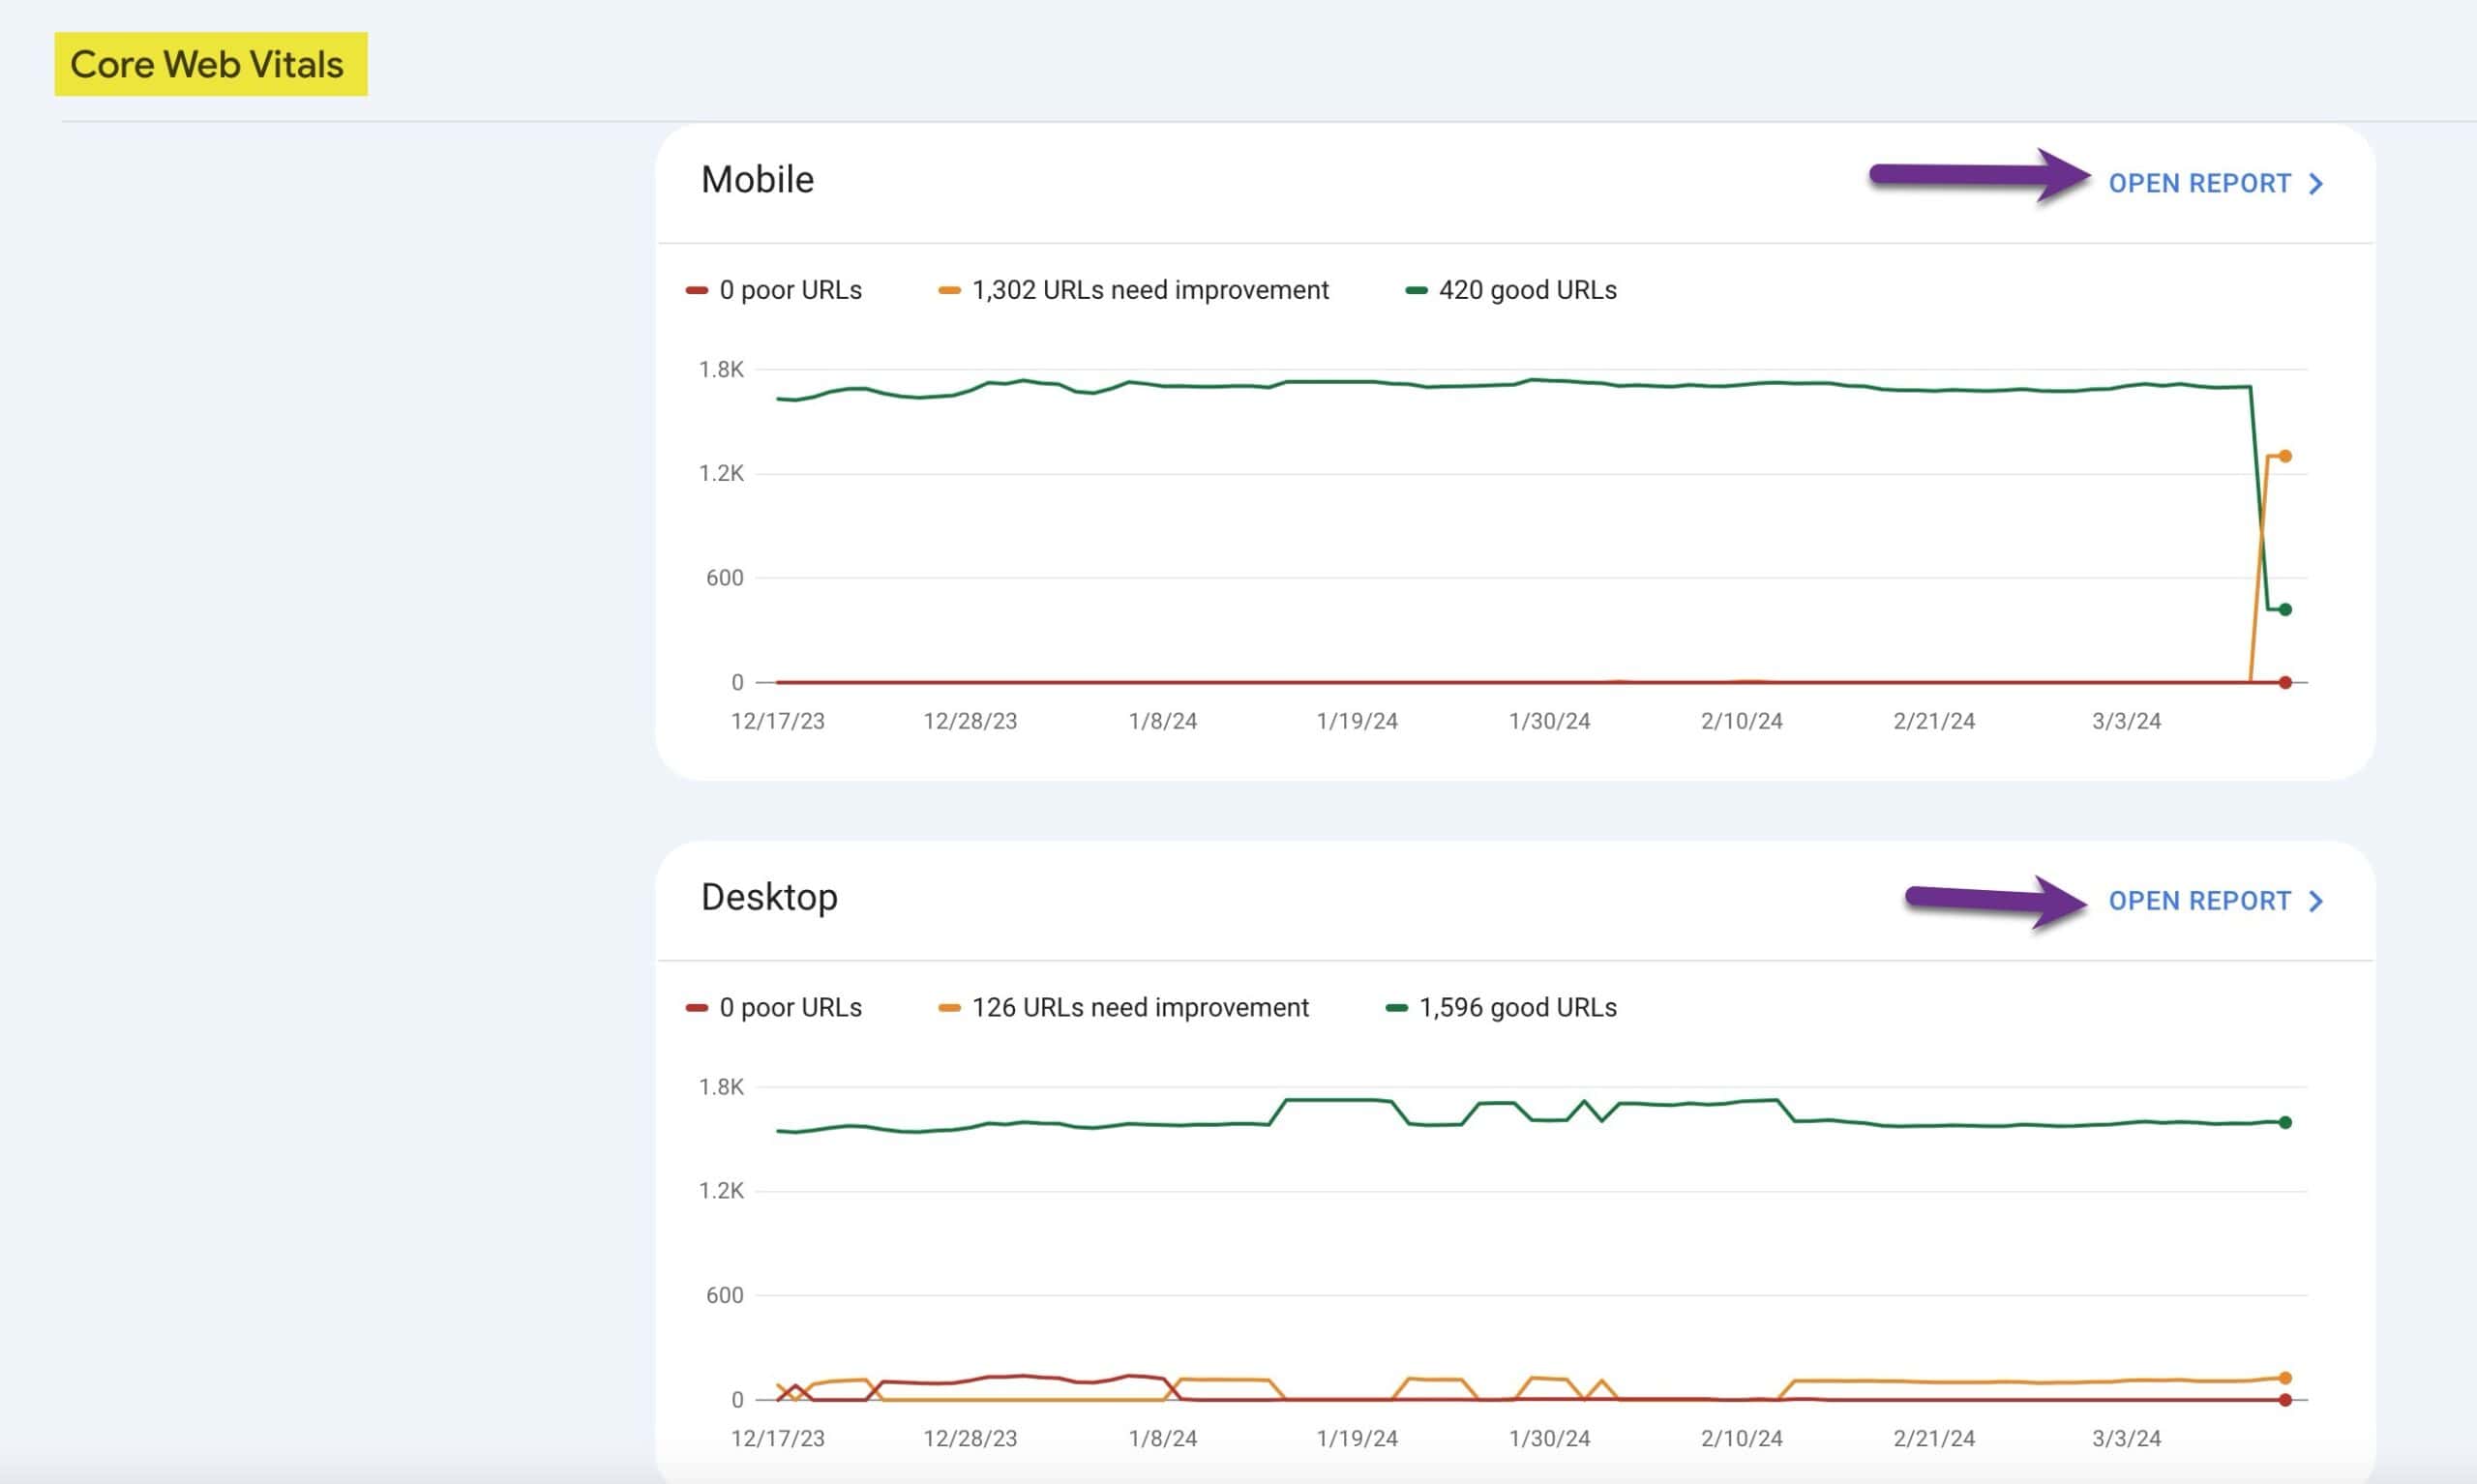
The Core Web Vitals section in your Search Console dashboard will also provide details of how your site is fairing for mobile and desktop vitals, as well as which vitals might be problematic. Clicking on the Open Report link for mobile and desktop will show deeper reports and more information.
* One caveat about the Core Web Vitals reports in Search Console is that they can lag behind the real-world values in the CrUX reports. If you’re seeing improvements in your numbers when testing in PageSpeed Insights but not in Search Console, it can be helpful to click the Validate Fix button within the individual issues to start a new evaluation period which can help get the Search Console reports up-to-date with the real data.
Learn More
Yoast’s overview of Page Experience and Core Web Vitals.
Andrew discusses Core Web Vitals on the Food Blogger Pro Podcast.
SEO for Publishers Webinar Episode #6 – Core Web Vitals Explained.


If someone’s page speed is slow, what can they do to fix it?
Hi Chloe,
There are many, many factors to consider when working on performance improvements — too much to cover in a comment (or just one or two blog posts).
At a super-high level, though, you’ll need to make sure your site has reliable and fast hosting (so pages are returned quickly), resources are delivered quickly (including images) — ideally from a Content Distribution Network if you have a geographically distributed audience — and then the content of the pages needs to be as streamlined as possible. It’s all about what you have on the page, and the order in which is it is downloaded and shown to the user. It’s important for the browser to render “above the fold” content first, since that should be visible right away — the rest of the page, and perhaps other interactive features, can be loaded a little bit later, once the visitor has something to start reading.
Images can be a major speed issue, so be sure you’re using small, well-optimized images (don’t upload 4000×5000 pics directly from your camera!), and “lazy loading” the images will help a lot too.
Google’s resources at https://web.dev/learn/ and https://web.dev/lighthouse-performance/ are quite good.
Running performance tests at https://pagespeed.web.dev is also a great place to start – you can test your site and work through the “Recommendations” and “Opportunities” sections for details on what that testing tool says you can improve.
Hope that helps!